
Machine learning is alchemy – researchers in artificial intelligence at Google have recently proclaimed. Any high school or college student that has ever tried to solve nonlinear systems of equations with gradient descent method knows that already, kind of… Even for a perfect bowl-shaped cost-surface, gradient descent method will converge only if the step sizes are sufficiently small. The Google researchers are of course talking about many more things than just the learning rate, and they have won the test of time award for their outstanding work so we are not picking an argument with them. The point is that even though the neural nets we use here are rather simple we will come face to face with choosing a learning rate that works.
In the earlier post Multivariate Regression with Neural Networks: Unique, Exact and Generic Models we laid the groundwork for obtaining the polynomial relationship between inputs and outputs via a neural network. Here we get down to the actual business of training the network for a sample problem where the two outputs are 3rd degree polynomials in two inputs. We obtain the Exact prescribed model in all cases as we claimed. Further we look at the impact of the following and verify the other claims we made earlier to be valid as well.
- Training data size. There should be no impact as per our claim about being Generic. Changing the data size yields different training data and we will verify that we converge to the prescribed model nevertheless. Moreover we want to use the least amount of data possible. But there is a minimum amount of data required.
- Starting guess. Again there should be no impact as per our claim about being Unique. Initial guesses that are orders of magnitude off from the target are used to test this.
- Learning rate. Wisely we made no claims regarding this. Too large a learning rate will cause numerical instabilities and the model will not converge.
- Gradient estimate. We employ the Stochastic Gradient Descent (SGD) method for marching towards the minimum. SGD estimates the gradient by picking a smaller randomized sample of the training data set. The smaller the better of course as it cuts down computations… but pushed too far, it can lead to grossly incorrect gradients. This is in a way similar to using a bad learning rate.
As the 4th of July is round the corner, we will close the post by training a network to predict the trajectory of a hostile projectile so a robot can shoot it down if needed. Just so the post is not just about some dry numbers and convergence rates!
1. Data Non-preparation
In all the work here we do not massage or scale the training data in any way. Neither do we choose the starting guesses or the input values to have some advantageous distribution. That is, we do not prep the data in anyway whatsoever. We use the raw inputs and outputs as per the prescribed model and choose the initial guesses at will.
There is a good bit of experimental evidence to suggest that scaling the training data and starting with normally distributed weights and/or biases (zero mean and unit variance as a thumb rule) will help with convergence of the neural network. But why and how exactly they help is difficult to explain except with a lot of hand waving. It is a can of worms and we do not want to go in that direction here where we are talking about being exact, unique and generic. Just does not jive with our objectives for this post.
But fortunately (or by design perhaps?) the class of problems we have chosen to work with (simple multivariate polynomials) and our approach to regression with neural networks is in a one-2-one correspondence with what least squares estimation does. By
- expanding the inputs to have all the required nonlinear terms,
- using linear input summation and identity activation functions, and
- not employing hidden layers
we pushed all the nonlinearity to the inputs and rendered the model linear so that we basically have a linear transformation of the inputs to get the outputs.
We have gone over this in the earlier post and there is a closed-form expression for the model that the least squares derivation obtains in terms of all the input & output measurements. And we know that the least squares approach does not require scaling the data in some mysterious ways, and it sure does not have the luxury of specifying the inputs to sample at. So we expect that we should not have to scale the data, or prefer some inputs over others etc… in what we are doing here and be none the worse for it. We will find that this indeed is the case. As for the starting weights and biases, we have already claimed that our neural network can obtain the target model with any starting guess. So we do not impose any distribution on them to pick from – i.e we choose them at will.
2. Network Model for a Multivariate Polynomial
Consider the following outputs  and
and  that are nonlinear in
  and
and  .
.
(1) 
There are no cross terms here like  , but that will not change our approach to implementing regression with a neural network. We
- add an artificial input neuron for each nonlinear term, and
- do not employ hidden layers
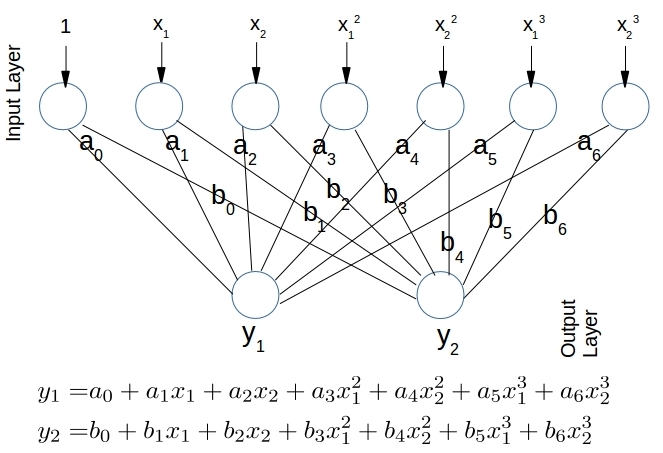
Figure 1. The network model for Equation 1. With arbitrary starting values for  and
and  we want to converge to their target values in Equation 1 so the exact relationship between
  and
and  is captured.
The resulting network model is shown in Figure 1 above. Given  measurements for inputs and the corresponding outputs we have this relationship (review Equations 7 and 9 in the previous post for further reference)
(2) 
The target weight matrix  we want to converge to for any starting guesses, and any training data is:
(3) 
2.1 Training data
We need to generate measurements using Equation 1. While it may seem straightforward, there are two questions to answer.
First, what is the minimum data size that we can get by with? We have 7 unknowns in the model Equation 1 to predict each output. So we will need a minimum of 7 measurements. In the general case we will need as many measurements as the number of rows of . Later we shall see that having a bit more data than the bare minimum is useful as it speeds up convergence and shortens the overall training time, even while there are more data points to work with.
Second, can we choose any and for these measurements? For all practical purposes yes, but not a blanket yes! Our neural network attempts to minimize the sum of squares of errors at the output layer. This is exactly the same cost function that a least squares approach to the problem minimizes in order to estimate the best fitting . While the neural network does this in an iterative fashion with SGD, the least squares approach has a closed-form solution and gets it all in one shot as:
(4) 
This will only work if  is non-singular, thus requiring that
  have linearly independent columns. In all our simulations we choose to be greater than or equal to the number of rows of thus satisfying #1 above. But we do not explicitly ensure that and used obey #2, as the possibility of ending up with an that has a rank less than 7 is minimal as
- and are randomly picked
- there are squares and cubes of and as columns
Here is a sample python code snippet to generate the training data.
nActualInputs = 2 # the number of actual predictorsnR = 2 # the number of responses
degree = 3 # the degree of the polynomial
nP = nActualInputs * degree # the number of inputs/predictors for the neural net   nP = actual_inputs * degree
dataSize = 7

#y_1 =  1.0 - 2 * x_1  + 3 * x_2 - 4 * x_1^2  + 5 * x_2^2  - 6 * x_1^3 + 7 * x_2^3
#y_2 =  -81.0 + 71 * x_1  - 61 * x_2 + 51 * x_1^2  - 41 * x_2^2  + 31 * x_1^3 - 21 * x_2^3

Wtarget = np.array([ [1,-81], [-2,71], [3,-61], [-4,51], [5,-41], [-6,31], [7,-21] ])

xRange = 1.0 # i.e. random inputs between -1 and +1

predictor0 =  2 * xRange * np.random.rand(dataSize, nActualInputs) - xRange #   Random predictor values between [-xRange, xRange)
predictor =  predictor0
Predictors = predictor0
nextDegree = 2
while (nextDegree <= degree):
   predictor =  predictor0 * predictor        # The powers
   Predictors = np.hstack ( (Predictors, predictor) )  # dataSize x (np+1)
   nextDegree = nextDegree + 1

Ones = np.ones(dataSize).reshape(dataSize, 1)  # A column of '1' values
X = np.hstack ( (Ones, Predictors) )  # dataSize x (np+1)
Y = np.dot(X, Wtarget)  #   The responses as per the model
The neural net employs identity is the activation function and the cost function is the sum of squared errors at the output layer. The implementation of the feed forward, backward propagation, and the stochastic gradient descent technique are as described in Michael Nielsen’s web book Neural Networks and Deep Learning.
The default/base-case parameters for all the simulations here are as follows. Each of the parameters are varied separately (keeping all the others at their base values) to gauge their impact. The results are in Sections 1.2 – 1.5.
|
|
Training Data Size |
Stating Guess
|
Learning Rate  |
Data Size for Gradient Estimation by SGD |
| Notes | A factor of -10 away from the target in Equation 3 | The full estimate from SGD | Only 7 randomly chosen data points are used to estimate the gradient | |
| 14 |
|
1.0 | 7 |

![\[ \begin{bmatrix} -10 & 810 \\ 20 & -710 \\ -30 & 610 \\ 40 & -510 \\ -50 & 410 \\ 60 & -310 \\ -70 & 210 \end{bmatrix} \]](https://xplordat.com/wp-content/ql-cache/quicklatex.com-fa0304f8dffa4773ca36229d95a3fe86_l3.png "Rendered by QuickLaTeX.com")
As the training continues and the estimate for improves, the simulations record the model error as the Frobenius norm:
(5) 
2.2 Effect of training data size
Figure 2 below shows the impact of the training data size (or equivalently using a different training data set) on model convergence.
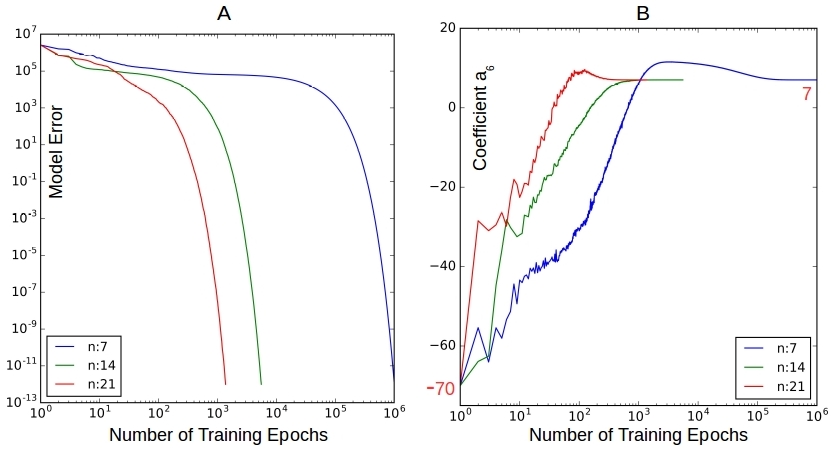
Figure 2. Effect of Training Data Size . A minimum of 7 data points is required but a few more will yield faster convergence
Figure 2A shows that we obtain the target model in all cases proving the Generic claim, but the model error decreases faster for larger . The number training epochs required to achieve the same level of error reduction are orders of magnitude higher when too few data points are used. The reason of course is that the estimate of the gradient is poorer with  vs
vs  . Figure 2B shows that the target value of 7 for
  is achieved in all cases starting at -70. Takes as many as
  training epochs with 7 data points as opposed to about
  epochs with 21 data points.
2.3 Effect of starting guess 
Figure 3 below shows the convergence rate as we start the simulation farther and farther away from the base – by factors 10 and 100.
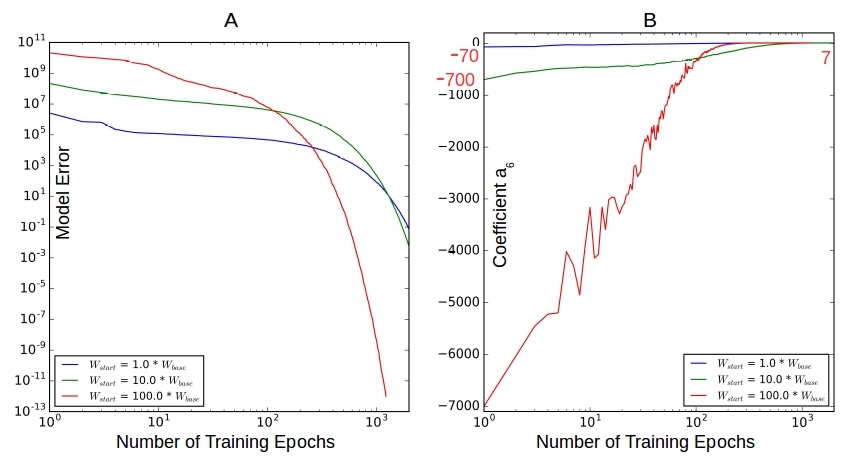
Figure 3. The effect of starting . Not much. The convergence rate is high enough when we are far from target so that the number of training epochs required for convergence is about the same in all cases.
Figure 3A shows that the even while the starting model errors are very different they all converge well within 1000 training epochs. The faster convergence rates when far away from minimum allows the poor guesses to catch up so to speak. Figure 3B shows that the parameter converges to its target value 7 in all cases in about 500 training epochs
2.4 Effect of the learning rate .
Figure 4 below shows the most dramatic impact yet as the learning rate is varied. All our earlier cases have converged to the target model, but not here – leading to the alchemy proclamations we started this post with. We want our neural net to learn fast, in fact as fast as possible. So we want to use the maximum possible learning rate for a given neural net and training data. But unfortunately this maximum possible learning rate is a complex and unknown function of pretty much everything affecting the computations in the network training process so we do not know it ahead of time.
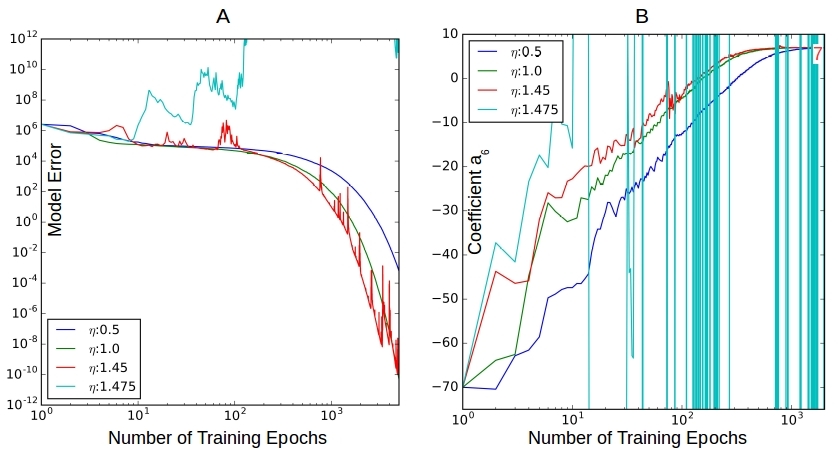
Figure 4. The effect of learning rate . A good bit. The maximum learning rate we can use will be a function of the overall computational dynamics in the network.
Figure 4A shows that decreasing the learning rate to 0.5 from the base rate 1.0, makes the convergence go slower. In both cases the error reduction is pretty smooth. When we increase it to 1.45, the convergence rate does increase a bit but we see oscillations showing up – it is no longer a smooth reduction in error. But it does converge. Increasing the learning rate a tiny bit more to 1.475 leads to large overall increases in model error as training continues and the simulation falls apart. Figure 4B illustrates the same behavior for the parameter , with no convergence for = 1.475.
How did I come to discover this transition from convergence to divergence that seems to happen somewhere  ? By trial and error. Our net is small enough to experiment with but for real-life neural nets with hidden layers and thousands of parameters, choosing the right learning rate that works well to start with and dynamically varying it as the simulation progresses is an art. This is an active area of research in machine learning.
2.5 Effect of the SGD batching
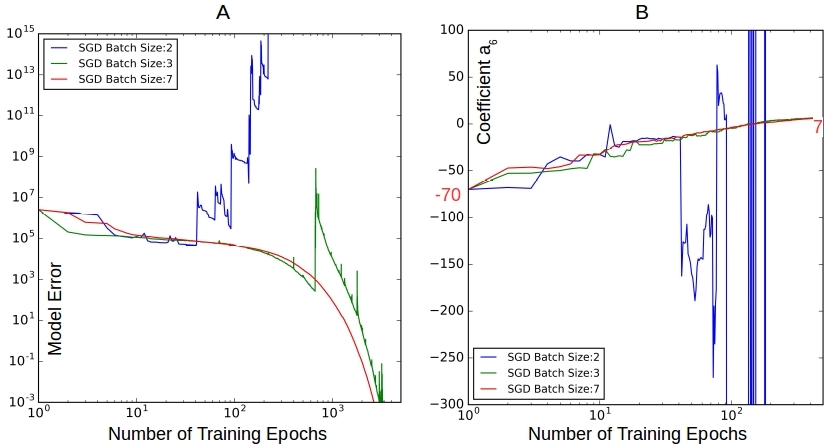
Figure 5. The effect of SGD batching. Seems to have no benefit at least for our case with small data size. Too small a batch like 2 data pooints does not work at all. While 3 data points achieves convergence, the number of training epochs does not really reduce from using 7 data points.
In a single training epoch the training data is randomly split into distinct mini batches. The model is updated after training with each batch. That is, the gradient is estimated using only a piece of the training data rather than the entire set for updating the model. The smaller the batch size, the quicker we can update and arrive at a converged model – hopefully. But on the flip-side, the smaller the batch size, the more inaccurate the gradient estimate is. This is akin to using a bad learning rate as we see in Figure 5 above. Figures 5A and 5B show that we need a minimum of 3 data points per batch to estimate the gradient that is good enough to lead us to convergence. But the number of training epochs has not reduced if at all, so we might as well use 7 and get steady convergence. SGD batching is useful when we have a lot of data to train on.
3. Training to Shoot
For a fun use case consider a projectile that has been blasted out at some initial velocity  and an angle
  . Based on a few initial measurements of time and position, that is,
  we will use a neural network to decipher its future trajectory so we can potentially shoot it down before it lands. The equations that describe the trajectory of the projectory are well known.
(6) 
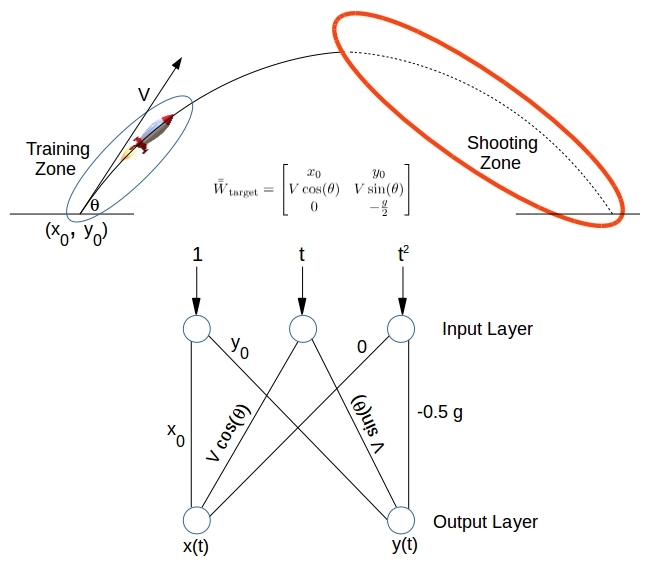
Figure 6. Training a neural network to predict the trajectory of a projectile. X, Y locations at three different instants are sufficient to estimate the unknowns – Release location (x0, y0), Release Velocity V, Angle of Release θ, and gravity g
We will employ a neural network to figure out the initial velocity , the angle of release  , and throw in the gravity
  as well – yes why not? Figure 6 above illustrates the training/shooting zones, the target model
  , and the neural net to obtain it. Having gone through this exercise several times, no further explanation is needed.
The first quarter of the projectile trajectory is sampled to generate the training data needed to train a neural net. Our only real input measurement is time  . The outputs that we want to be able to predict are
  and
and  for any , not just the range in the training zone. We need a minimum of 3 measurements. Once we converge, the velocity and the angle of release are derived from the obtained model.
(7) 
We start with the following model that is a factor -10 away from the target. Note that this means starting with a that is equal to the target value as per Equation 7 above as  is unchanged. Our starting turns out to be 1000.0 m/sec, while the starting and target is at 15 degrees.
![\[ \begin{bmatrix} 10000.0 &-965.93 & 0 \\ -5000 & -258.82 & 49.05 \end{bmatrix} \]](https://xplordat.com/wp-content/ql-cache/quicklatex.com-71c299d5f98b6d58cf1b4ae6b7788dde_l3.png "Rendered by QuickLaTeX.com")
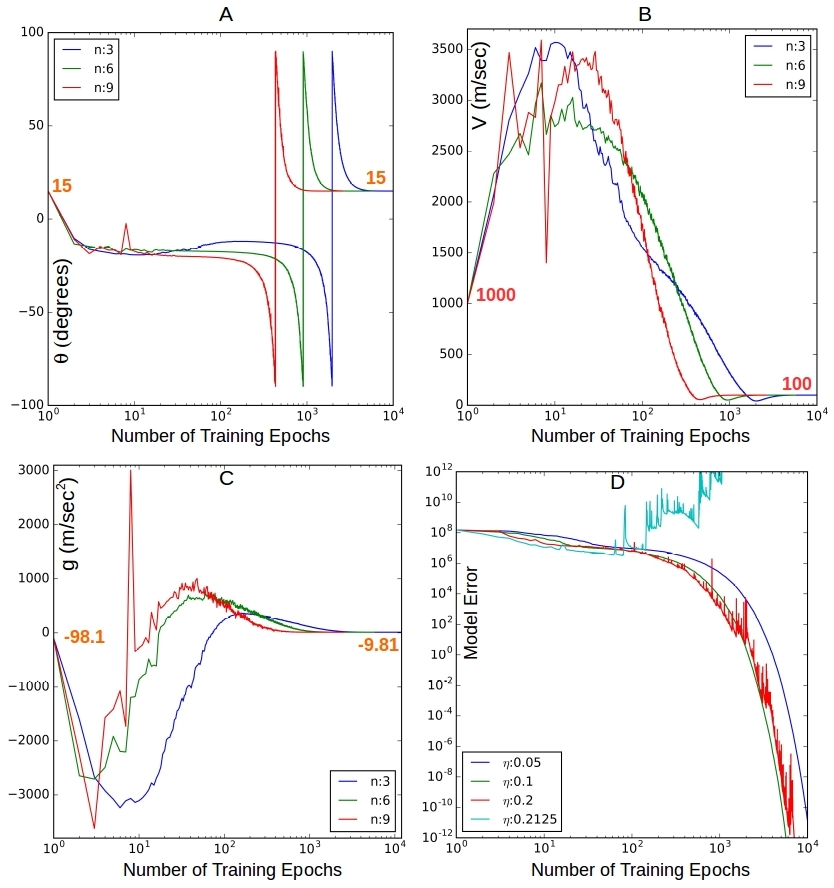
Figure 7. Obtaining the target model for projectile motion. In 7A we start with the target value for θ but it goes through some gyrations as V and g are not at their target values before converging back to the starting value when V and g also have converged. Figure 7D shows divergence for the learning rate 0.2125.
Figures 7A-7C show the convergence to the target model for different training data sizes. Figure 7D shows that the learning rate is once again factor in convergence. Compared to the polynomial case earlier, the allowed learning rate for convergence is much smaller – by an order of magnitude. Why? Both are modeling a polynomial in the actual input variable(s). In fact in the projectile case all we have is a quadratic in whereas the earlier one was a cubic in and . I have some ideas as to why but will need to test further.
4. Next Steps
We are building up this series with a view to using neural nets for real applications such as approximating complex and unknown nonlinear relationships between inputs and outputs. Solving these toy problems is to get a foot hold and develop some intuitive understanding into the mechanics of neural nets from what we already know about linear transformations and least squares. In future articles in this series we will try to solve more complex problems where we cannot push the nonlinearity to the inputs thus requiring hidden layers and nonlinear activation functions in our neural net.
You don’t show a print command to show that plots how can we do it?
Hi Alez,
The simulations were with Java implementation of the neural network. I do not think I put it up on github as it was too much work to make it pretty & annotated. But the plots were with matplotlib. I still had the old data & code as it happens on my disk and I can reproduce these images.
For example let us focus on Figure 7D. The Java implementation outputs a csv file with convergence info as the epochs continue… It looks like:
epoch,rcost,rreduction,vcost,vreduction,tcost,treduction,merror,mreduction
-1,1.3140937277039307E8,-1,1.2037361922957614E8,-1,1.1500721959134057E8,-1,1.52462911142025E8,-1
-1,1.3140937277039307E8,-1,1.2037361922957614E8,-1,1.1500721959134057E8,-1,1.52462911142025E8,-1
0,1.2583020608764175E8,0.9575436168278528,3.735420098429583E7,0.3103188325097547,3.517327156153047E7,0.30583533526428136,1.346956838762456E8,0.8834652497929246
…
The above file is then processed with the following python script to generate the “png” image. I will e-mail you the zipped files so you can play with them and convince yourself that it is all correct & reproducible 🙂
from PIL import Image
import numpy as np
import matplotlib.pyplot as plt
import math
#get_ipython().magic(‘matplotlib inline’)
#
p = 2
m = 2
linestyles = [‘-‘]
colors = [‘b’, ‘g’, ‘r’, ‘c’]
#learningRates = [‘0.5’, ‘1.0’, ‘1.5’]
learningRates = [‘0.05’, ‘0.1’, ‘0.2’, ‘0.2125’]
runs = [’10’]
wFactors = [‘1.0’]
#
# epochNumber Vs log (model_error_reduction) for different sizes of the training data & learning rates
#
epoch_merror_datasize_Fig = plt.figure(figsize=(6,6),dpi=720)
subplot = epoch_merror_datasize_Fig.add_subplot(1, 1, 1)
subplot.set_xlim(1, 10000)
subplot.set_ylim(1.0e-12, 1.0e12)
colorIndex = -1
for learningRate in learningRates:
for run in runs:
for wFactor in wFactors:
colorIndex = colorIndex + 1
lrdir = “../run_wf_” + wFactor + “_n_” + run + “_lr_” + learningRate
lrfile = ‘./’ + lrdir + ‘/convergence.csv’ # Just getting the file name
print (‘File:’, lrfile)
convergence = np.genfromtxt(lrfile, delimiter=’,’, names=True)
labelTxt = ‘$\eta$:’ + learningRate
subplot.loglog(convergence[‘merror’],color=colors[colorIndex],label=labelTxt)
subplot.legend(loc=’lower left’, prop={‘size’: 12})
epoch_merror_datasize_Fig.savefig(‘lr_epoch_merror_datasize.png’, format=’png’, dpi=720)
#Image.open(‘lr_epoch_merror_datasize.png’).save(‘lr_epoch_merror_datasize.jpg’,’JPEG’)