
By the end of the previous post in this series we had built a mechanism to slice & dice the H-1B approval data. With that in hand we can start exploring the data and hopefully find some interesting insights so all that hard work so far was not totally useless…
1. H-1B over the years
First we look at how the H-1B program has fared over the years in terms of volume of applicants & wages, through the boom & bust cycles of US economy. Couple of notes regarding wages are in order:
- We ignore those few applications with very high (over a million) or very low (below $10k) offered wages, as they are likely typos.
- We use ‘nominal’ wages as reported, with no adjustments made for the changing value of US$ over time.
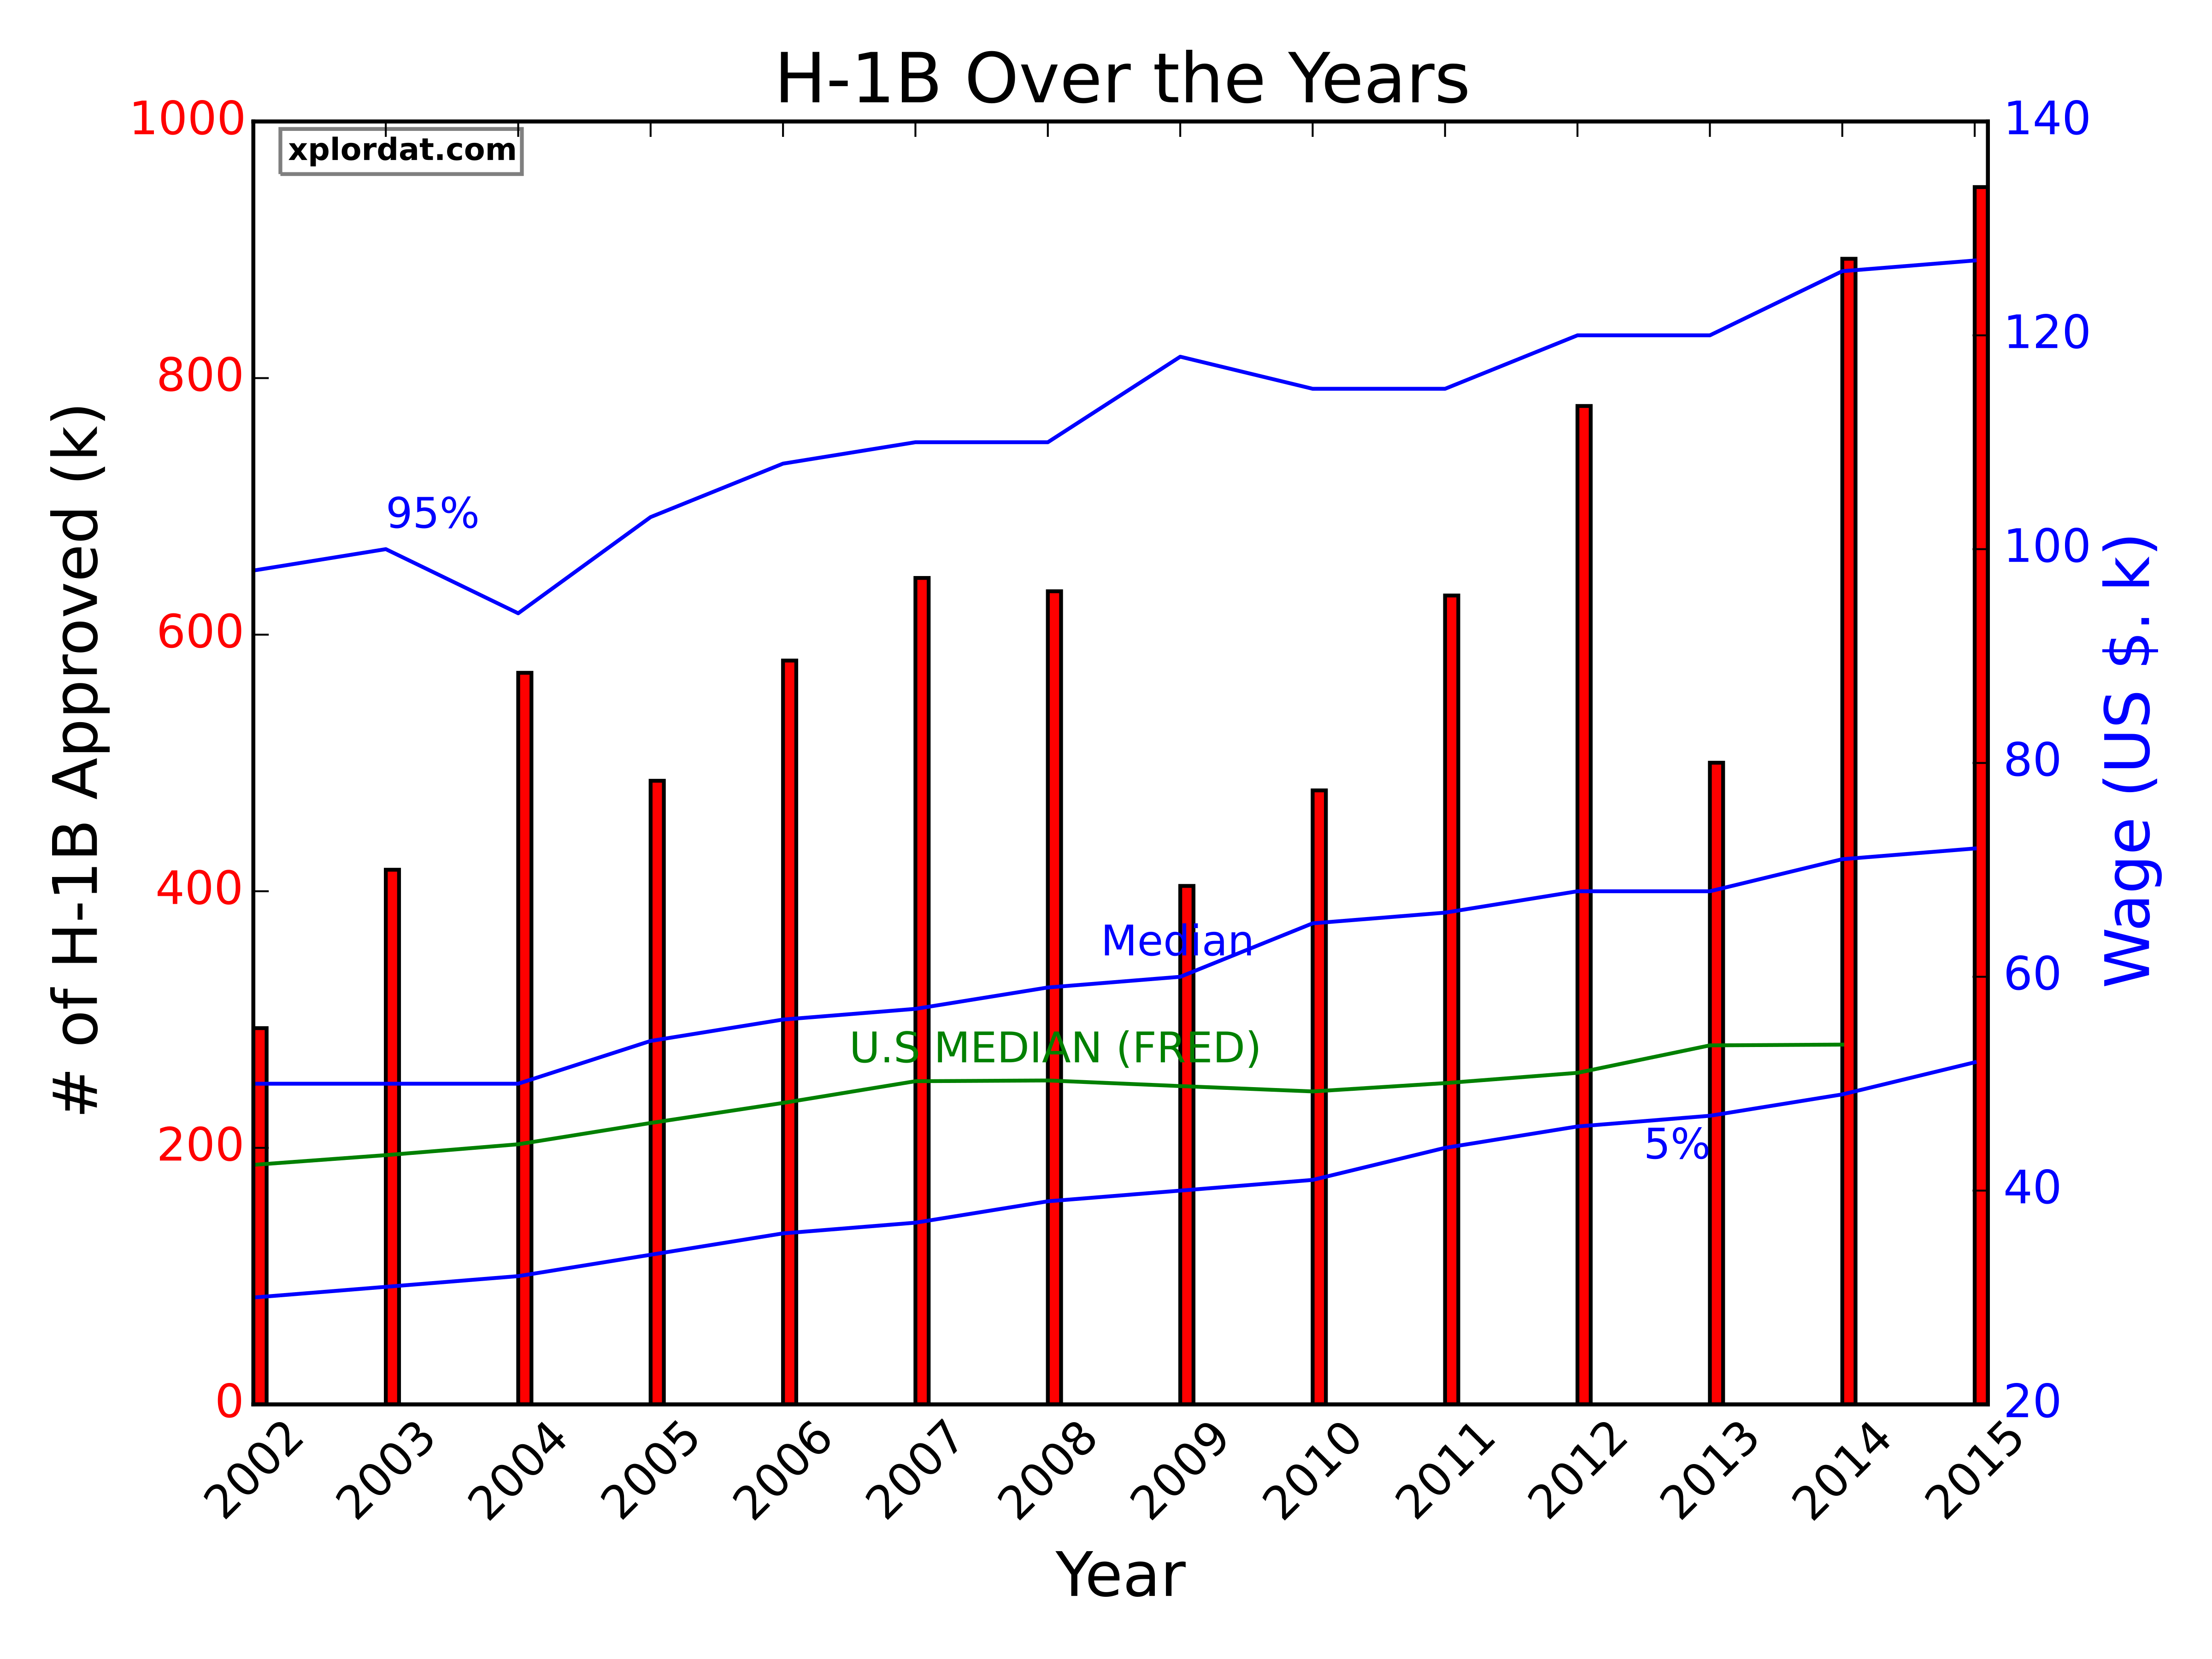
- The volume of H-1B applications seems to be generally on the increase. The applications plummeted some in the aftermath of the great recession, but recovered to set records by 2015. The data for the year ‘2002’ was incomplete, and ‘2013’ is perhaps an anomaly.
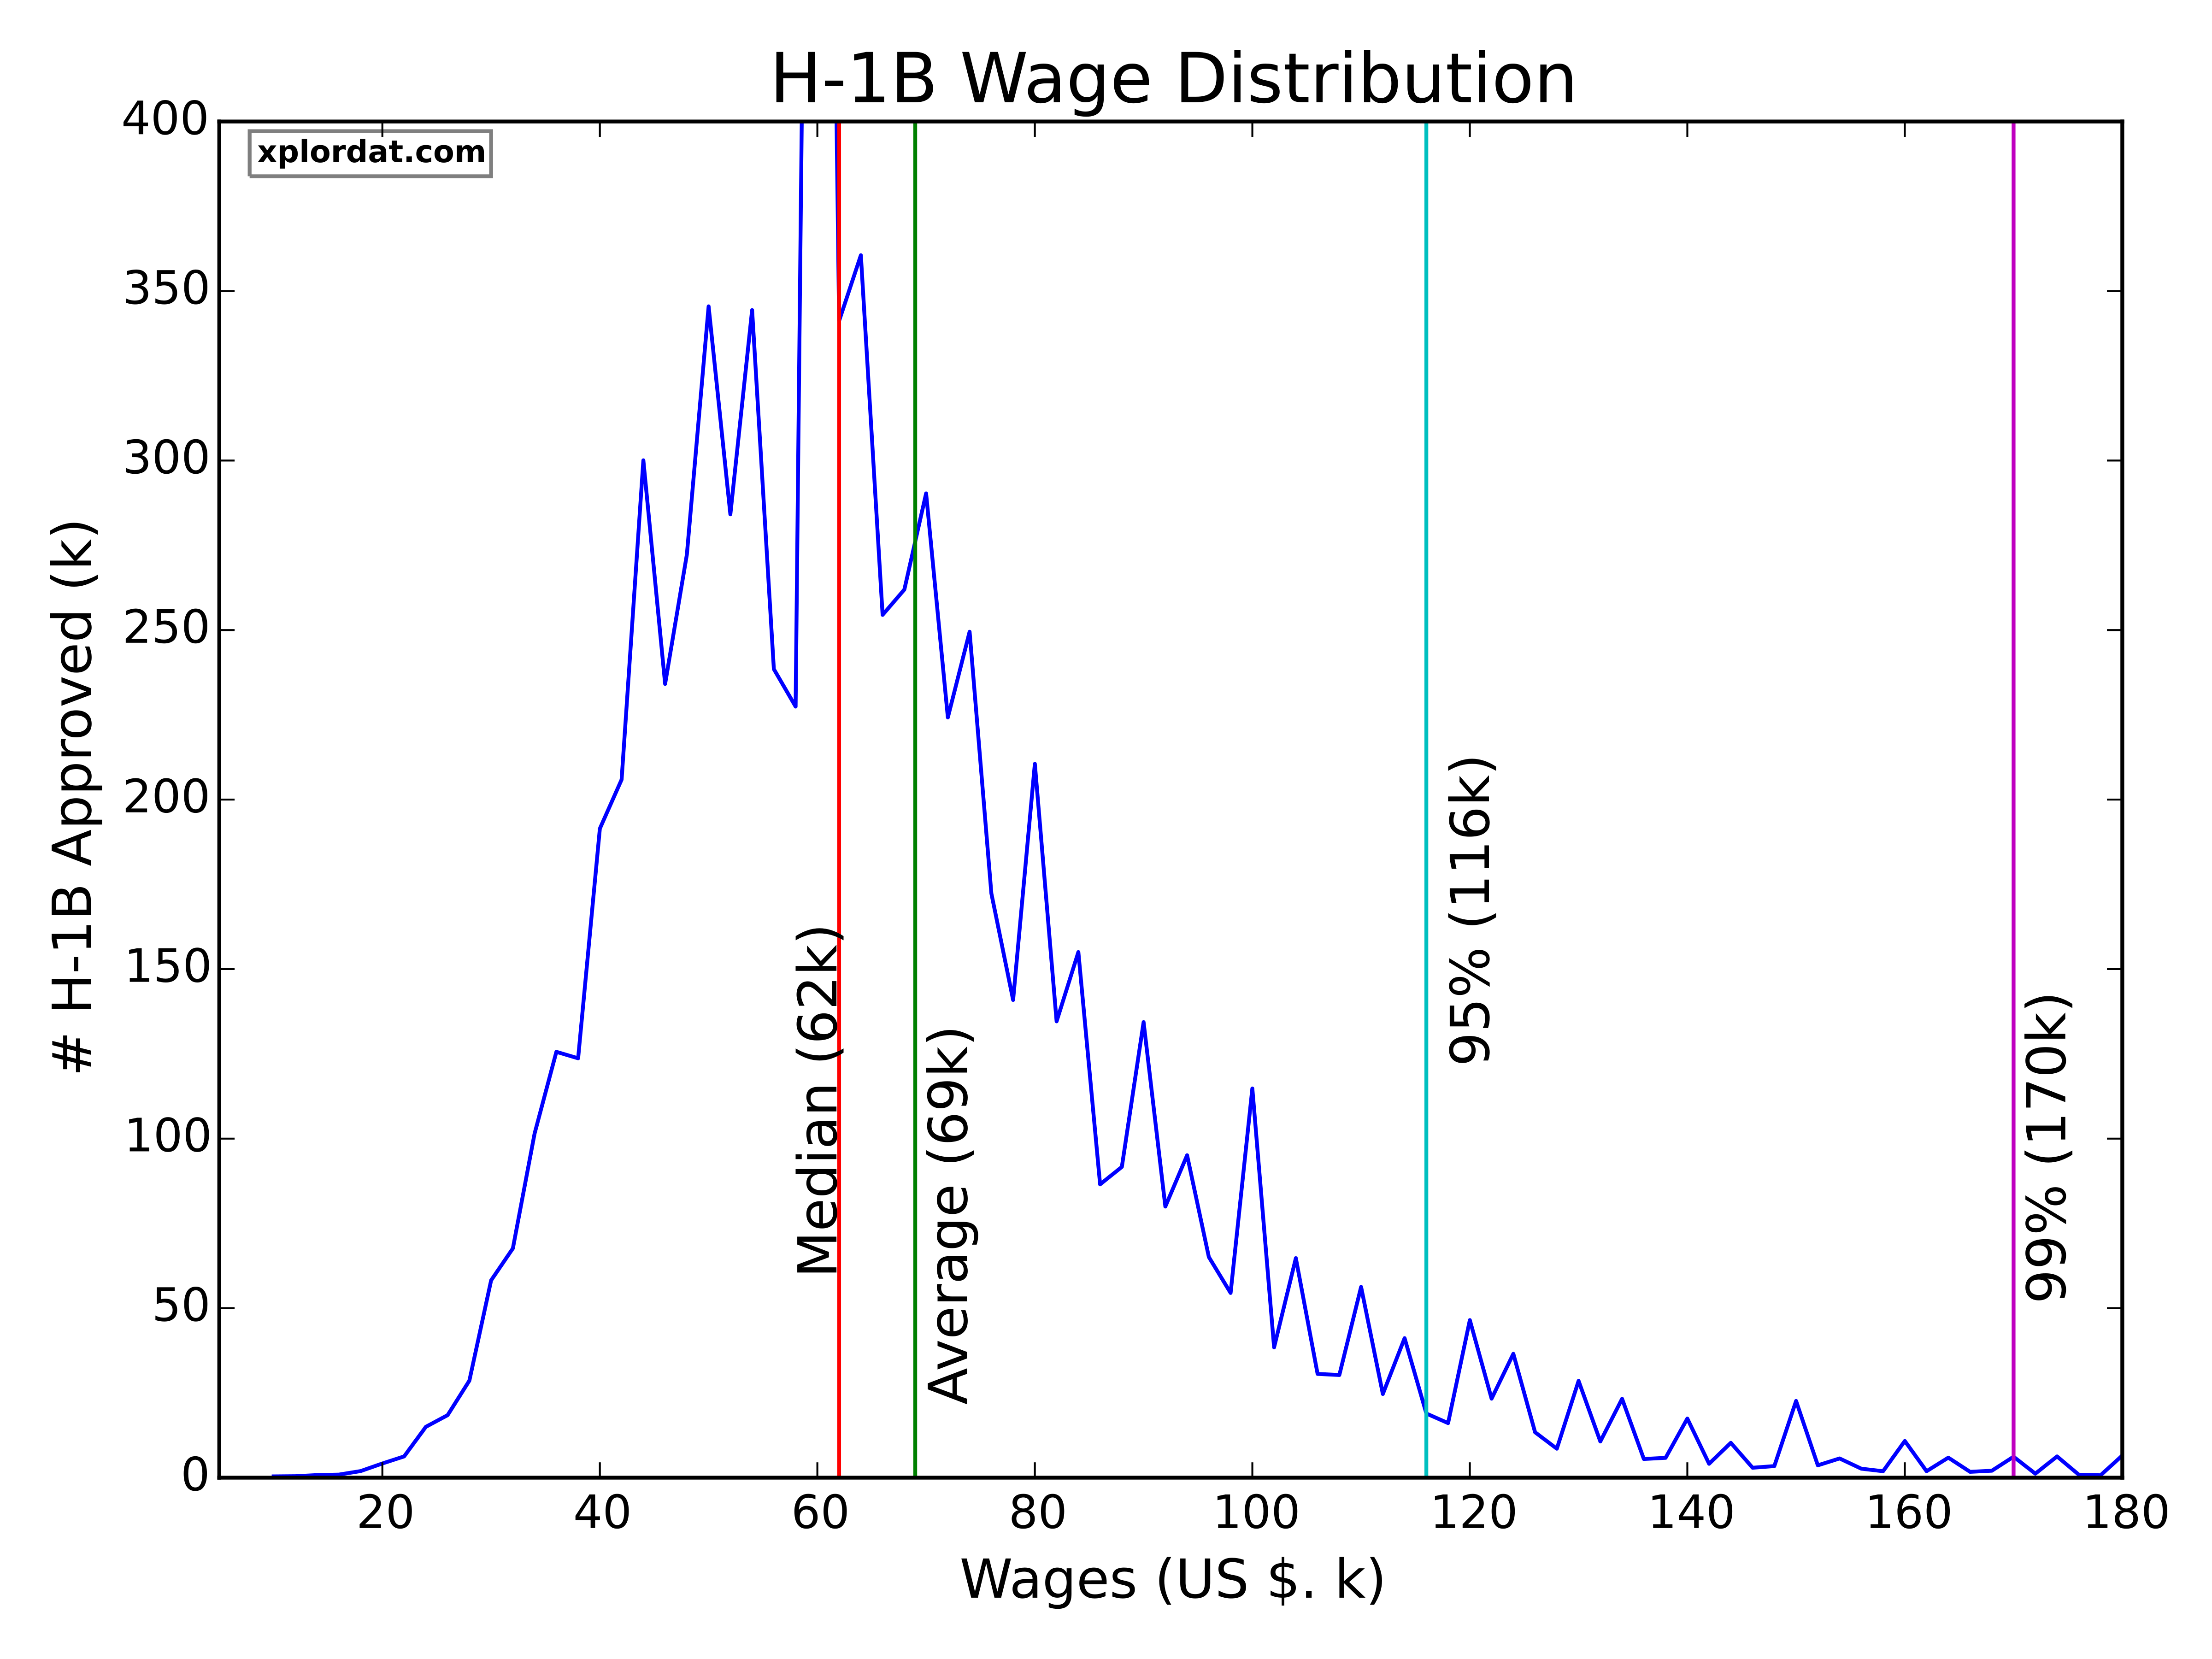
- The median offered wages have seen a healthy increase from about 50k to 72k in 14 years, about 44% increase. Also shown are the 95 & 5 percentile wage lines that show similar increases. The much larger separation between the 95% and the median compared to the separation between the median & 5% implies that wage distribution should be quite skewed to the right, with large number of applicants compressed to narrow lower wage zones. This is exactly what we see in the wage distribution below. The wage distribution is positively skewed as expected pushing the mean past the median. It is striking that out of all the the approved applications (8.26 million), over 4.3 million are for under the 62k wage & fully 7.8 million are under the 116k wage.
- The St. Louis Federal Reserve publishes a lot of Economic Data (FRED) and we can get a recent report on U.S. median household income over a similar span as above. The median US household incomes have risen from about 42k to 54k over a similar period. While the U.S median wages are lower than those for H-1B applicants, this comparison is flawed because FRED takes into account ‘all’ workers. What we should be comparing against is a group of workers that is ‘similarly distributed’ in skills/trades as the H-1B applicants. I do not have that kind of data readily available of course. But we will look at what this group consists of later, but it is generally loaded with software, high tech, & research skill sets who are expected to command higher wages.
2. Volume Leaders & High Rollers
Next we look at the sponsors that are filing for H-1B visas – how they are distributed with respect to both the number of filings (‘Volume Leaders’) & wages offered (‘High Rollers’). Couple of notes regarding the computations here are:
- In order for the wage leaders to be statistically significant, we do not consider sponsors with too few filings even if they were to be offering high wages. Here we take that to be about 1500 filings in this 14yr period (or about 100 a year)
- We ignore those few applications with very high (over a million) or very low (below $10k) offered wages, as they are likely typos.
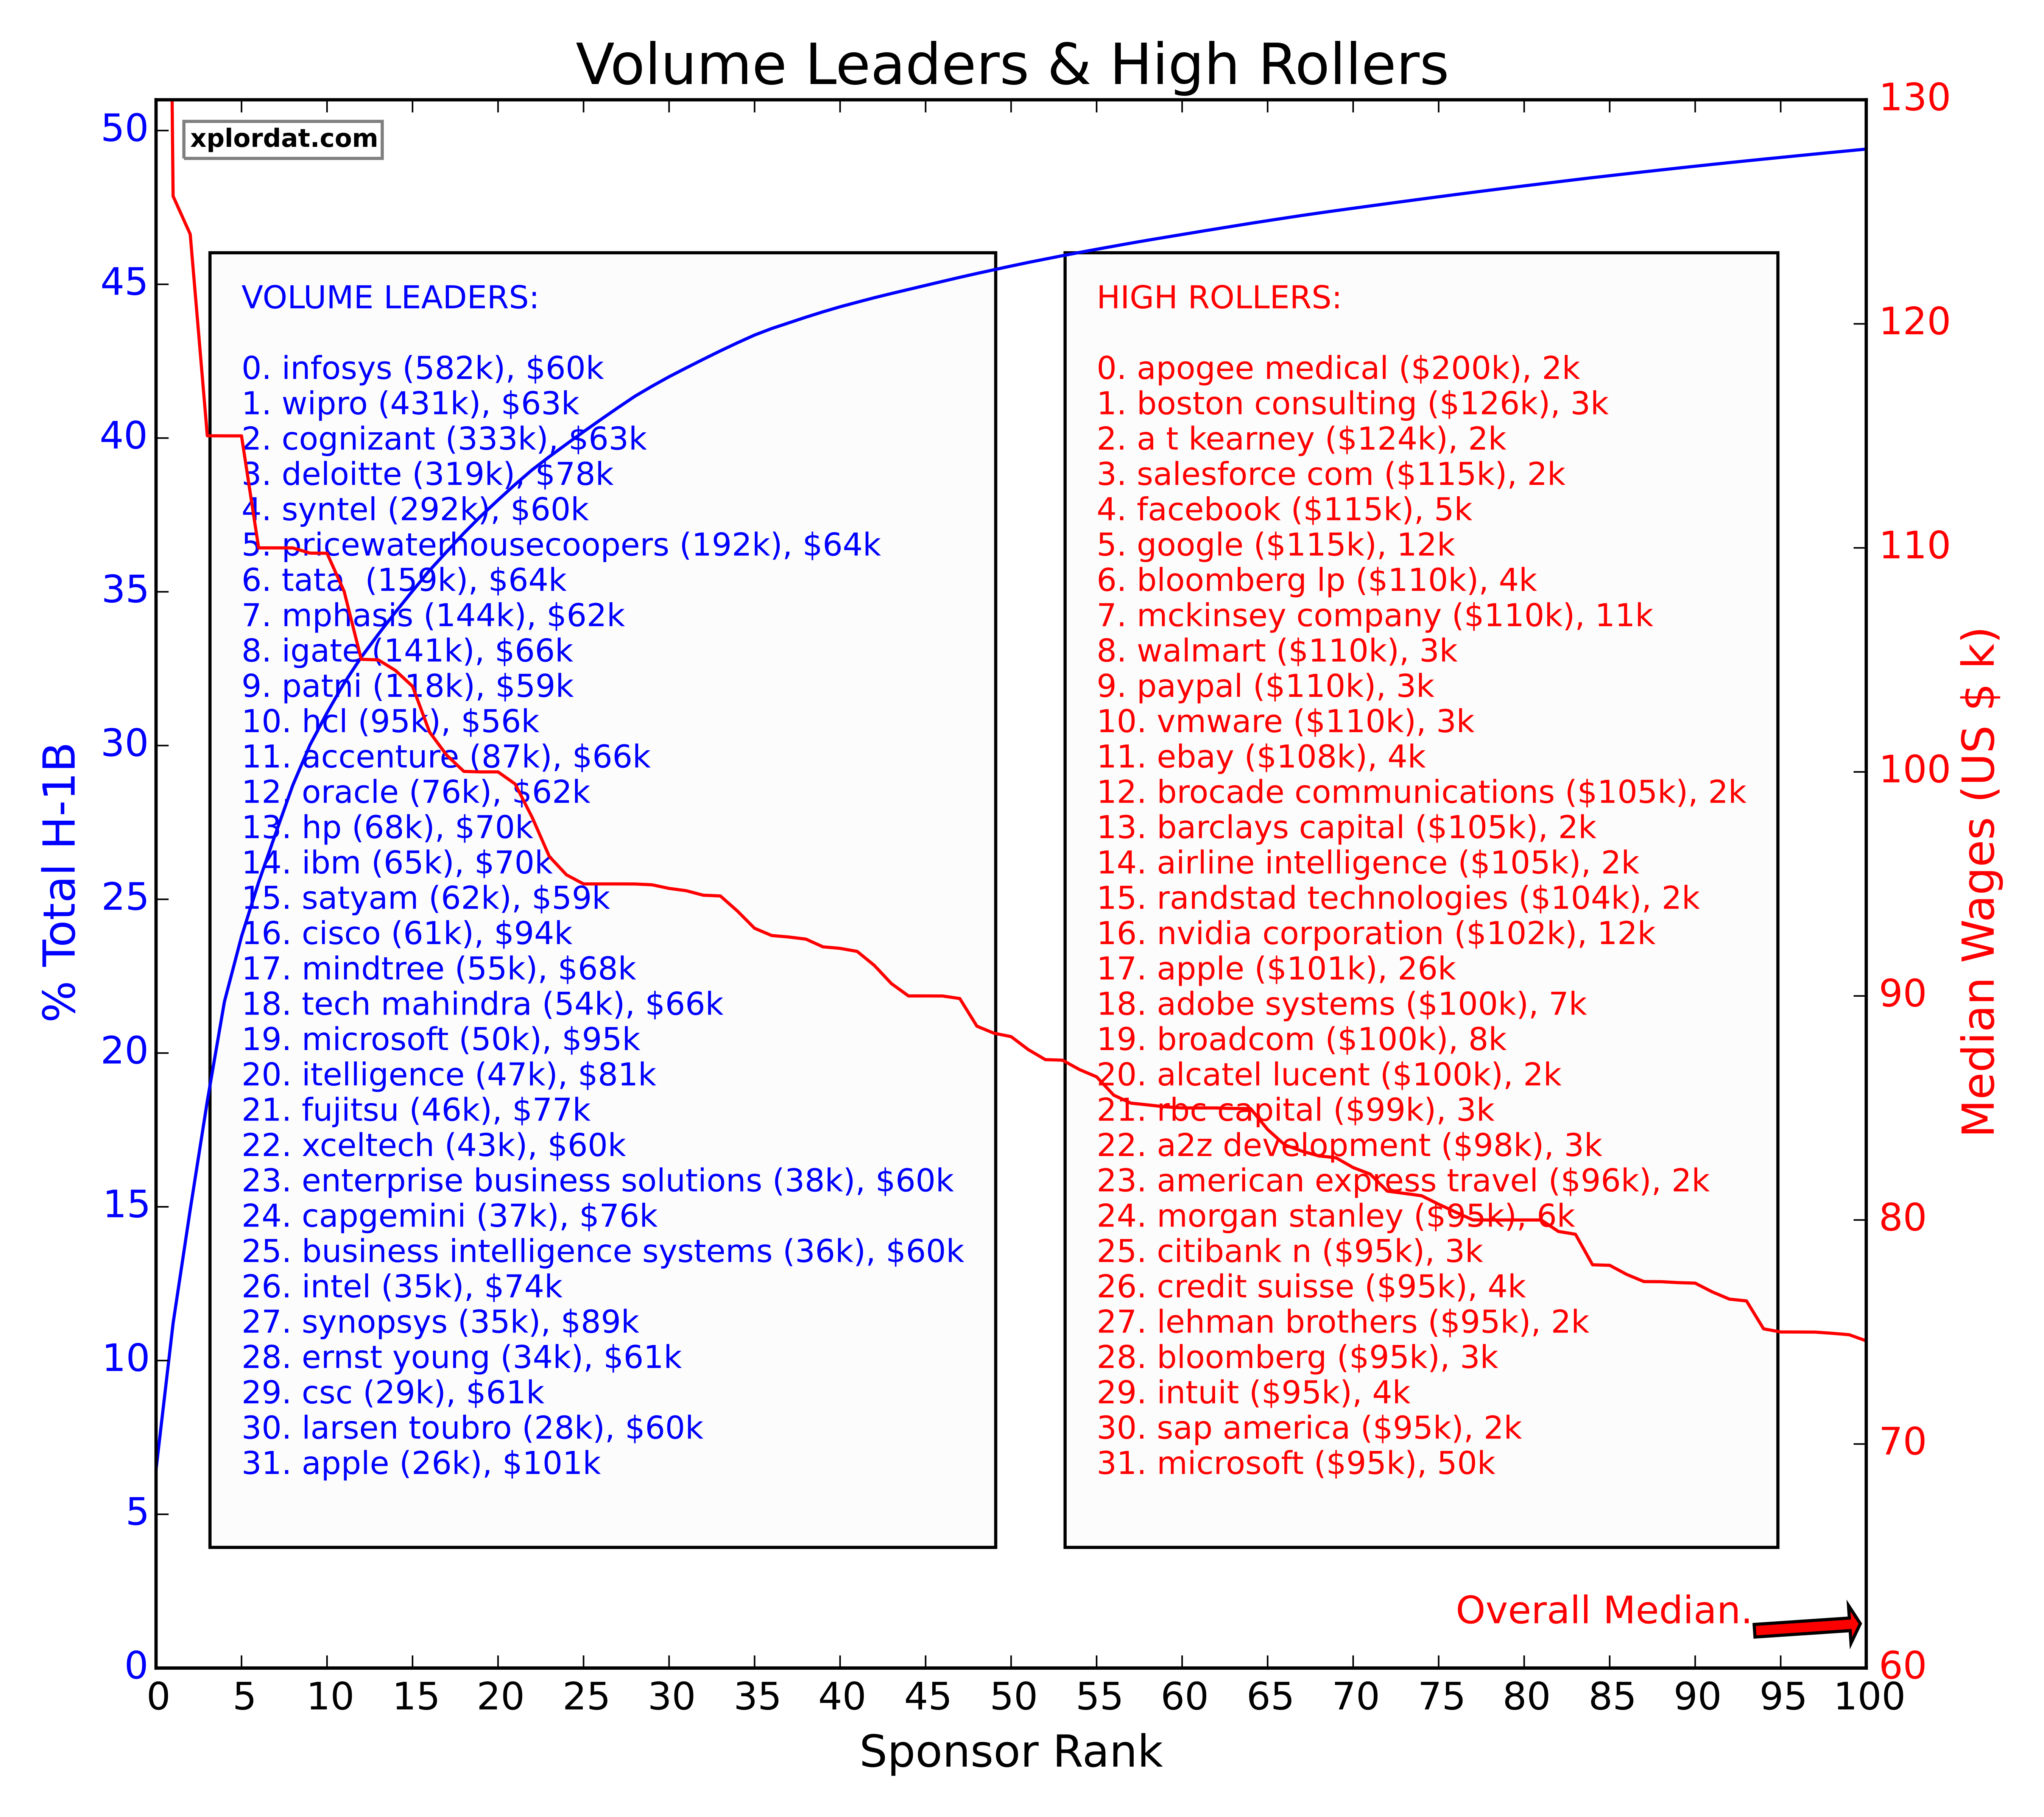
The results are decidedly stark. I had no idea that things were so lop sided until I got the analysis done. Here are some easy observations:
- The top 100 sponsors (by volume) are responsible for over 50% of the filings. The cumulative distribution function (the blue line above) raises so sharply in fact that the first 5 sponsors have 22% of the filings among them, and the first 25 sponsors have 40%. While we do not exactly know how many ‘unique’ sponsors we have, that number is thousands & thousands over the years.
- Even within the top 32 sponsors (by volume), the numbers are so heavily skewed to the top that the 32nd ranked “Apple” has only filed about 4% of the top sponsor ‘Infosys’.
- The top leader for wages is in healthcare – no surprise there I guess.
Digging deeper, the two leader boards make for a fun comparison.
- The volume leader board is dominated by labor outsourcing firms that are in business to provide labor to firms here, while the wage leader board is filled with high tech names like Google, Facebook etc…
- The outsourcing firms are all offering about the median wage at $62k with the top volume sponsor falling short of that as well, so it looks like the volume leaders are likely driving down the median H-1B wages. That makes sense because these firms get paid by the ‘real’ employers, and take a cut from that amount before passing the rest on to the actual H-1B worker. That is their business model . They may hire some local admin staff on their own to manage the accounts but for the most part they do not directly create jobs here.
- Not one of the volume leaders figures in as a wage leader, save for ‘Apple’ & ‘Microsoft’ each of them securing the 32nd spot (no coincidence there – as I picked the magic ’32’ to include a few names that we all can identify with!). One thing that needs to be understood here is that the volume numbers for the ‘real employers’ represent their own ‘direct’ filings to bring in foreign workers. Now, this does NOT include those filed by the outsourcing firms they may additionally be using (I know for a fact that several of them do) to fill other positions.
- Apple with 26k filings at $105k & Microsoft with 50k filings at $95k, it is clear that the employers are ready for offer much higher wages when they want to ‘directly’ hire a H-1B worker. The direct hires are sought after, while the outsourcing firms are used to fulfil non-critical & less value-added positions. That can even explain to some extent why the wages are much lower for the outsourcing firms – because the employers are offering less for these positions to begin with. From a H-1B worker point of view, it is much better to target a direct hire position than going through an outsourcing firm.
We will stop with this line of analysis around volumes & wages for now and look at a few other ways we can slice & dice this data. That will be in a future post.
Thanks for reading & feel free to leave a comment if you liked it (or not!)