Ok, that was in jest, my apologies! But it is a question we should ask ourselves before embarking on a clustering exercise. Clustering hinges on the notion of distance. The members of a cluster are expected to be closer to that cluster’s centroid than they are to the centroids of other clusters. Given some data points, and a means to compute distance measure among them, it would seem that a computer program should be able to do this with enough number crunching. But we have to tread with caution. Given that this exercise is unsupervised, the algorithm has no a-priori knowledge of how the data is distributed in the feature space. Heaven forbid, if the data were to be uniformly distributed then there is no hope of realizing any meaningful clusters. Or worse, we will have as many clusters as the number of data points and we would have learnt nothing. The idea explored here is to check if the data itself can point us to a metric that can indicate the optimal number of clusters. That precisely is the focus of this post.
We work with synthetic numerical vectors in known clusters, so we can evaluate the approach. We stick to 2-dimensions as we want to visualize the obtained clusters and convince ourselves that it seems to work. K-means implementation in SciKit is the driver for all the simulations here. The source code for all the simulations here can be downloaded from github.
1. Optimizing the K in K-means
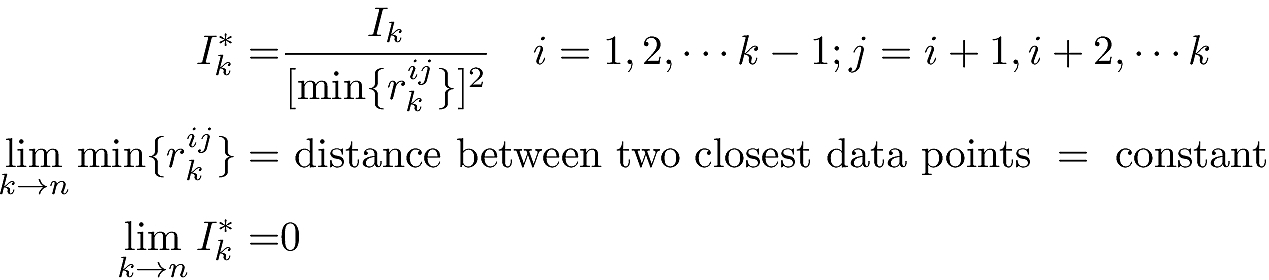
The popular K-means approach divvies up n data points into k clusters where k is specified as input. K-means identifies these k clusters by requiring that the sum of squares of distances of data points in each cluster to that cluster’s centroid is minimized. With Ci as the ith cluster, x as any data vector/point in that cluster, and μi as the centroid vector/point of that cluster, K-means minimizes the overall inertia of the k clusters Ik defined by:
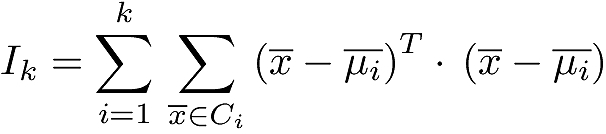
Figure 1 illustrates this with a 3-cluster example. K-means rightly attempts to make the k clusters as tight as possible, but what is the best value for k is the question. Can Ik and any other auxiliary information tell us if our k is the best?
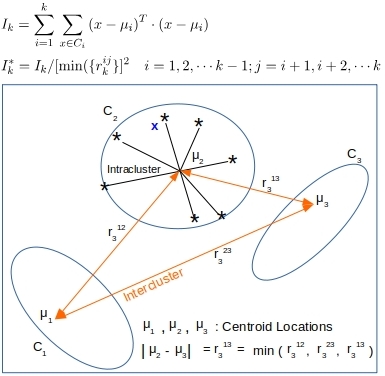
Figure 1. K-means minimizes the overall inertia Ik of the k clusters. For k = n, Ik would be the absolute minimum at zero. But that is of no value. Ik* couples that criteria with maximizing the minimum intracluster separation. The k that minimizes Ik* is likely the optimal k for k << n
Let us consider the following arguments.
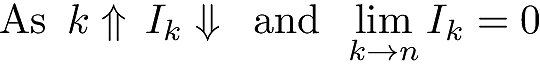
- When k equals the number of data points n, each data point is its own cluster and Ik will be identically equal to zero – its minimum possible value. So clearly the k that minimizes Ik is not the optimal k.
- As k increases, the intercluster distances will decrease. So the inverse of the minimum intercluster distance will increase. With rkij as the distance between cluster i and cluster j when k clusters are simulated,
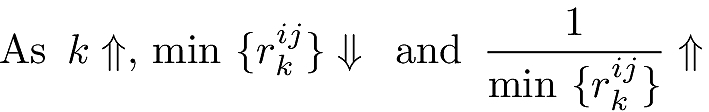
Combining the above equations we define a new metric Ik*
So we are basically using the intercluster distance as a counterbalance to Ik. They both decrease as k increases, but their ratio is better behaved as per simulations and has a local minimum for k << n.
Let us be very clear that we are only talking about a local minimum that can be detected by running simulations starting from small k values to larger k values. As k increases towards n, the total number of data points, the global minimum of 0 will be reached as each data point becomes its own cluster.
2. Perfectly Clustered Datasets
To see how this metric can be useful, let us say we have 14400 points in 2-d, grouped into 9 distinct clusters in a 3×3 grid. Each cluster has 1600 points evenly placed on a 40×40 grid. See Figure 2 below.
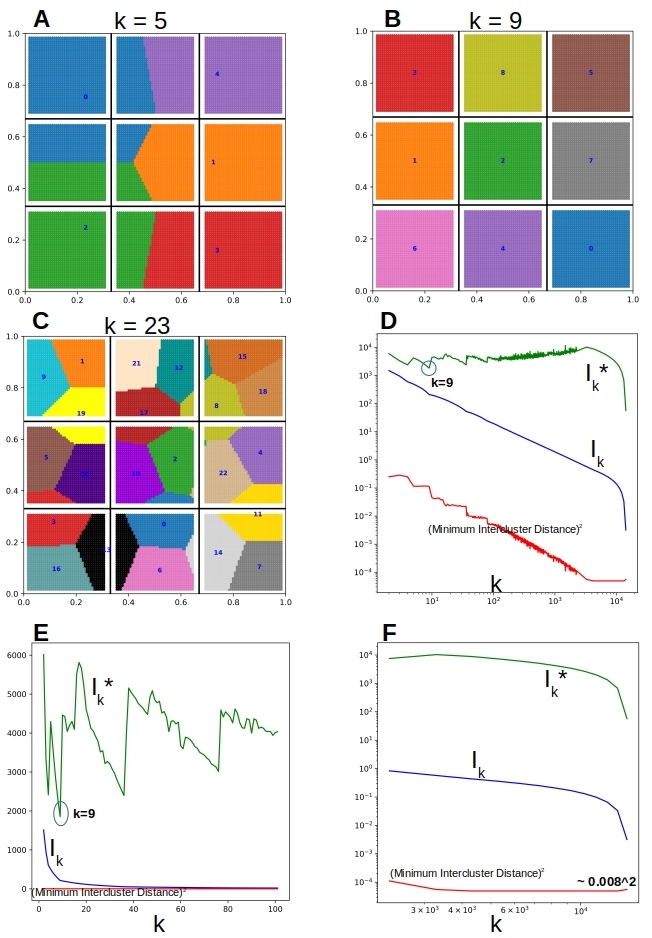
Figure 2. K-means on perfectly clustered data with 9 actual clusters. (A -C). K-means will split the data into as many clusters as we ask it to. The dark grid lines show the actual separation boundaries. The numbers indicate the centroid locations of the clusters that K-means has found (D) Both the inertia and the minimum intercluster distance decrease as k increases (E) Ik* has a detectable minimum at k=9 that we can use to pick the right number of clusters (F) The inertia is driven to zero as k increases to 144000, whereas the intercluster distance reaches a constant value.
When we run K-means with k=9, we get the correct identification of clusters as seen in Figure 2B. The numbers in the figure are the locations of the centroid and they are smack in the center of each cluster as our data would indicate. When K-means is run with k=5 in Figure 2A, it splits true clusters into pieces, and even combines them with pieces from other true clusters to identify as a cluster that it found. Figure 2C shows the same when run K-means with k=23, and we see the data getting split in all manner of ways.
The point here is that K-means will split the data into however many clusters you ask for. But Figure 2D shows that the metric Ik* oscillates even while both the inertia Ik and the minimum intercluster distance min{rkij} decrease steadily as k increases. Zooming in on small k, Figure 2E shows that we do indeed have a well-established local minimum at k=9. There are other local minima as well but they are all higher. Zooming in on larger k, Figure 2F shows that the minimum intercluster distance approaches the separation distance of individual points, whereas Ik (and so Ik*) dives to zero.
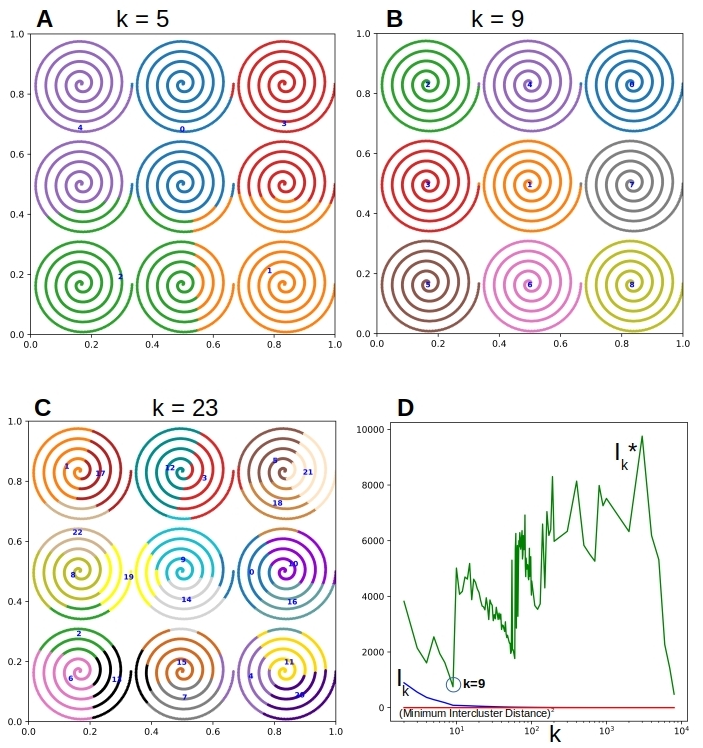
Figure 3. The internal structure of the clusters is not a barrier to detecting the optimal k as the k that minimizes Ik*
There is nothing special about the nature of clusters that allows/disallows the detection of this metric. Figure 3 above shows a similar exercise where data is clustered in spirals and the metric is none the worse for it as shown in Figure 3E where a clear local minimum is obtained for Ik* when k = 9.
3. Loosely Clustered Datasets
So that worked out well for perfectly clustered datasets. How will it do for data where the clusters are not so nicely separated? Let us consider a dataset of the same size as before but with some random error thrown in to the locations of the data points so the clusters are not so clear cut.
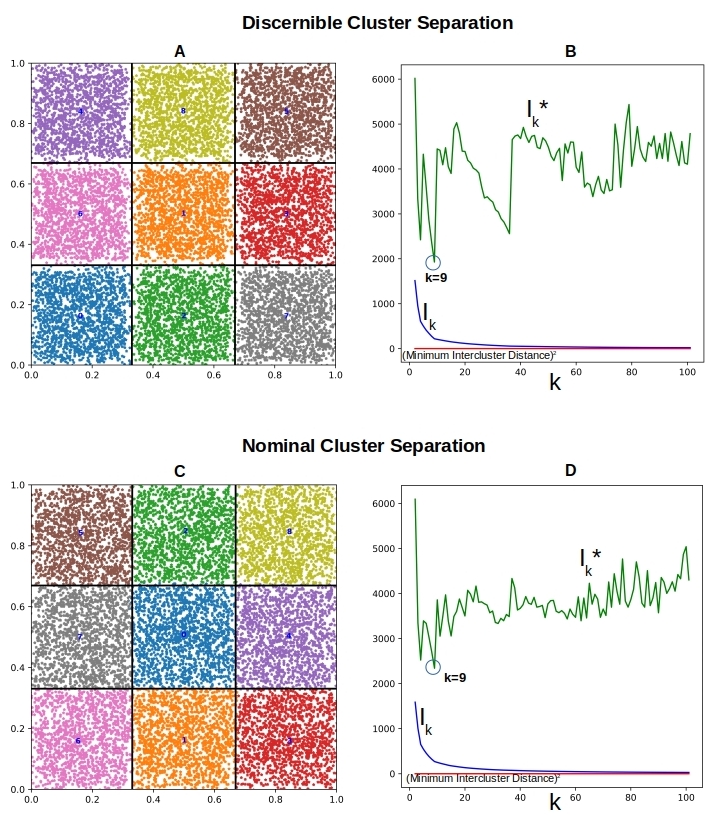
Figure 4. ( A-B). The clusters are visibly separable. Ik* has a clear local minimum at k=9, that is 20% smaller than the nearest local minimum at k=4 (C-D) The cluster separation is blurred. Ik* does show a local minimum at k=9, that is only about 7% smaller than the closest local minimum at k=4
In Figure 4A above we can visually pick out the clusters even without the grid lines helping us out. Not so much in Figure 4C where we only see a thin sliver of data free zone between the clusters. We put K-means to work here to detect these clusters. Figures 4B & 4D show that Ik* has local minimum at k=9 in both cases. This minimum is more clear cut in Figure 4B than in Figure 4D. That is to be expected of course given the diffuse cluster boundaries for the latter.
4. The Uniform Case: No Clusters
Finally we look at the case when the data is uniformly distributed so that there are no clusters. But as we know, K-means will come up with k clusters no matter. Can Ik* help us detect this situation and allows us to conclude that the data is not clusterable? See Figure 5 below where we have 14400 data points evenly distributed on a 120×120 grid.
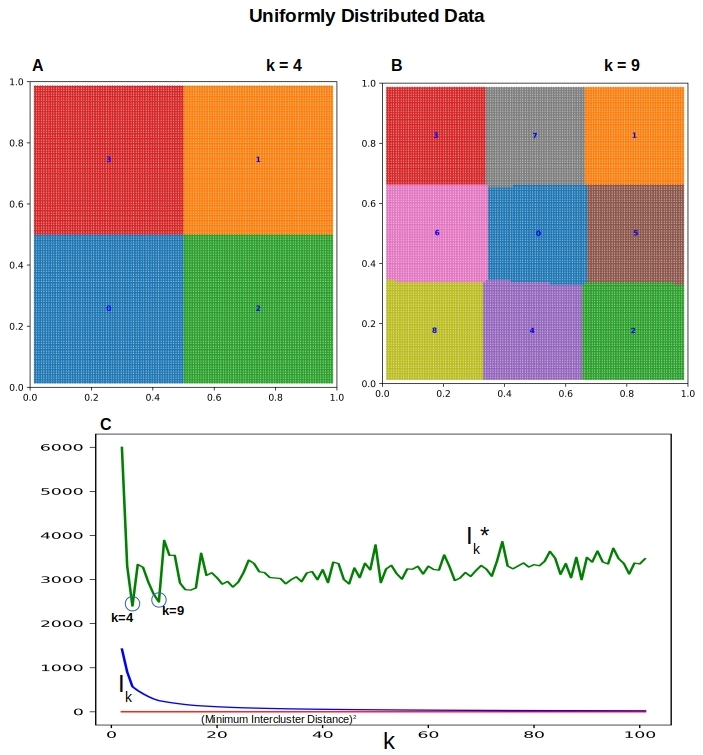
Figure 5. When the data is uniformly distributed, there are no real clusters. (A-B) K-means clusters with k=4 and k=9. (C) The lack of clear local minima for Ik* and the near constant nature of Ik* is an indication of unclusterable data.
Unlike in Figures 2 thru 4, the metric for Ik* in Figure 4C does not show a clear cut local minimum, Ik* does not vary much for the most part as k increases. It will go to zero eventually for large k, just like in the other figures, but for k << n the Ik* is more flat than otherwise. This is likely a clue for deciding that the underlying data is not clustered.
5. Conclusions and Next Steps
This post is a precursor to what we really want to get at – i.e. clustering text. Here we have established a plausible criteria to detect the optimal number of clusters while using K-means. The evidence is empirical and we have no proof that it will work in all cases, especially in higher dimensions with noise. Text is where the rubber meets the road of course with long vectors, context issues, and any number of ways of building those vectors. Should be interesting to see.