Feature space cracking new data introduces potentially useful new classes if detected. Spurts in the rate of increase of new data points with a less than acceptable classification confidence indicate that new data zones are being carved out in the feature space…
The only constant is change. And data is no exception. Detecting data evolution allows us to analyze further as to what it means to decision making down the line. For example we may be classifying patients as simply having a decease or not based on some initial data around the symptoms. But as the decease evolves, so do the symptoms and the appropriate treatment regimen thereof. A model trained on mild symptoms to detect the presence of a decease can still detect that decease with acute symptoms. But we would like to detect the anamoly as well while classifying this new data, raise an alert and flag it as potentially requiring a new class. Differentiating upfront between acute, intermediate and mild cases and classifying the patients as such has a huge benefit at many levels.
Clearly, the number of features have not changed and neither have the underlying concepts used in classifying the data. But the distribution of the incoming data has changed. The new data is carving out zones in the same feature space where there was no data earlier. This is feature space subdivision or more facetiously the fracking of feature space.
A model trained on older data/classes will bucket any and all data as per the classes it knows of – no surprises there. But flagging and identifying the new zones as potentially emerging new classes can be extremely useful. That in essence is the objective of this post. The focus is on presenting an approach. In order to do so we consider a simple problem with two features and a handful of classes. While the problem is contrived, the visuals can help drive home the point. The code to reproduce the results can be obtained from github.
What to do when you detect new classes in the data is problem dependent. For example, if we do indeed decide that a new class is warranted, we can label a part of this flagged new data and retrain the model
1. Feature Space Segmentation
A classifier trained on N classes will necessarily place the incoming data into any of those N classes. The entire feature space including all old and any new data points has already been divided into N zones. But the data the classifier has been trained with may not have been fully covering these zones. When new data starts to come in to occupy these previously empty zones – it is an indication that data is evolving.
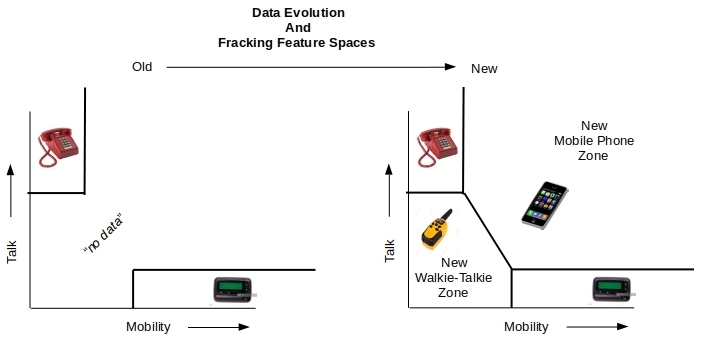
For example a model may have previously classified communication devices into desk phones or pagers based on the presence/absence of terms like “talk”, “mobile” etc.. But that model will be quite confused about walkie-talkies and mobile phones that have come to claim ownership of different pieces of the same feature space. Depending on the specific abundance of terms in the description, the model may label some of these products as pagers and the others as desk phones – exactly what the classifier has been trained to do. But it is less than optimal. Had we had the ability to detect the arrival of new data in these previously empty zones, we could have inspected that data and potentially defined new categories for them. Adding mobile phones and walkie-talkies as new categories and training the classifier to predict them would be a vastly useful enhancement to the classifier.
While we can visualize emerging cracks and new data zones in lower dimensions, it is not practical in higher dimensions. We need a global measure of sorts that we can track as part of the ongoing classification of new data. The behavior of this global measure should lend us clues to look for emerging new zones/classes. An indicator derived from classification confidence is what we will employ here to identify the fracking of the feature space. Let us review what classification confidence is about.
2. Classification Confidence
Most classifiers are probabilistic in nature (with notable exceptions such as SVM even though there are approaches to derive probabilities from distance measures). That is, the classifier when asked to predict the class of a new data point, it first comes up with a list of probabilities for that data point to belong to any of the available classes. It then picks the class with the highest probability. Now consider the following argument – mostly common sense.
- Every new data point is placed in a class – the class with the highest probability as computed by the classifier. The higher the probability, the greater the confidence in the classification of this data point.
- A new data point falling in a zone with a lot of training data will be classified with a high degree of confidence.
- The opposite of point 2 above. That is, a new data point falling in a zone with little or no training data will be assigned a class for sure but with a lower confidence.
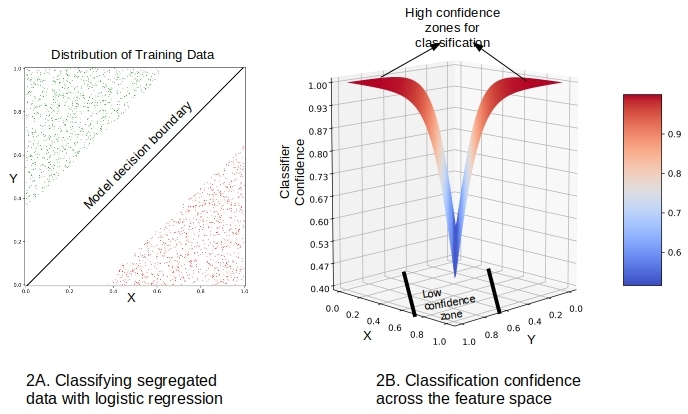
This is illustrated in Figure 2A below with a toy 2-feature, 2-class problem employing logistic regression as the classifier built on well-segregated data. The probability of a point belonging to either class is 0.5 on the linear boundary – that is, the confidence is the least. As we move away from the boundary and into the zones with data, the estimated probability of a point belonging to the correct class is higher – that is, the confidence is higher.
In general the classification confidence of a data point is the maximum of the N probabilities that this data point may belong to any of the N classes.
classification confidence
Figure 2B shows the computed classification confidence of this model over the whole feature space.
A fracking indicator
It follows from above discussion that when new data falls in previously unpopulated zones, the classification confidence of those new data points would be lower. So we choose a threshold confidence level and keep a count of the newly classified data points whose classification confidence as predicted by the model is below this threshold. When no new zones are being carved out, this count will be increasing at its normal background rate, as there will always be some nominal amount of data going into the unpopulated zones. But when the data is evolving, a higher (than background) fraction of the new data starts to go into those previously empty zones. This will show up as a sustained (well, assuming the data continues to evolve that way) spurt in the rate of increase of this count – all else being equal of course.
Loosely speaking then, we can identify feature space fracking by looking for spurts in the rate of increase of the number of new data points below a threshold classification confidence
fracking indicator
The probabilities we need to compute classification confidence are already being provided by the classifier as part of the classification task. So the number of data points below a threshold confidence, and its rate of increase are easy to compute and keep track of in an ongoing classification exercise. When we detect a sustained spurt in this fracking indicator, we can trigger a task to sample the specific new data with low classification confidence and decide whether to create new class(es) for them. Took a few words to get here but that is the approach. We will conclude the post with an example and code snippets
3. Simulation
Consider an initially well-segregated layout of four data zones and classes (A, B, C and D) shown in Figure 3.1 below. We have purposely left enough room in each zone/class for incoming data to carve out new zones/classes. Here is a snippet of code to pump data into any triangular region given the three vertices.
delta = 0.05 # Allows for some separation between data zones

triangles = [ [0.0+delta, 0.0+delta, 1.0-delta, 0.0+delta, 1.0-delta, 1.0-delta], [0.0+delta, 0.0+delta, 1.0-delta, 1.0-delta, 0.0+delta, 1.0-delta], [0.0-delta, 0.0+delta, 0.0-delta, 1.0-delta, -1.0+delta, 1.0-delta], [0.0-delta, 0.0+delta, -1.0+delta, 1.0-delta, -1.0+delta, 0.0+delta], [0.0-delta, 0.0-delta, -1.0+delta, 0.0-delta, -1.0+delta, -1.0+delta], [0.0-delta, 0.0-delta, -1.0+delta, -1.0+delta, 0.0-delta, -1.0+delta], [0.0+delta, 0.0-delta, 0.0+delta, -1.0+delta, 1.0-delta, -1.0+delta], [0.0+delta, 0.0-delta, 1.0-delta, -1.0+delta, 1.0-delta, 0.0-delta] ] # the vertices for 8 triangles

def getPointsInTriangle (n, vertices, label=None):
    p0x, p0y, p1x, p1y, p2x, p2y = vertices
    s = np.random.random_sample(10*n)
    t = np.random.random_sample(10*n)
    s_plus_t = s + t
    inside_points = np.where(s_plus_t < 1.0)[0]
    s0 = s[inside_points][0:n]
    t0 = t[inside_points][0:n]
    data = np.zeros((n,2))
    data[:,0] = p0x + (p1x - p0x) * s0 + (p2x - p0x) * t0
    data[:,1] = p0y + (p1y - p0y) * s0 + (p2y - p0y) * t0
    if label != None:
        labels = np.ones(n) * float(label)
        return data, labels
    else:
        return data
A multinomial logistic regression classifier is trained on data in Figure 3.1. It gets a perfect f1-score given that the classes are linearly and perfectly separable. The vertical and horizontal axes/lines are indeed the obtained decision boundaries. The points with low classification confidence (< 0.75) are obtained for tracking.
threshold_prob = 0.75
def getLowClassificationConfidence (probabilities, data):
    driftPoints = []
    for i in range (0, probabilities.shape[0]):
        if (np.amax(probabilities[i,:]) < threshold_prob):  # the ith class points with probability < threshold_prob
            driftPoints.append(i)
    return data[driftPoints]

initialZones = [0, 2, 4, 6] # A, B, C, D
data, labels = generateData (initialZones)
train_data, test_data, train_labels, test_labels = splitData(data, labels, 0.2)
model = LogisticRegression(max_iter=10000, multi_class='multinomial', verbose=0, tol=1.0e-8, solver='lbfgs' )
model.fit(train_data, train_labels)
probabilities = model.predict_proba(test_data)
print ('starting f1-score:', getF1Score (test_data, test_labels))
lcc_data = getLowClassificationConfidence (probabilities, test_data)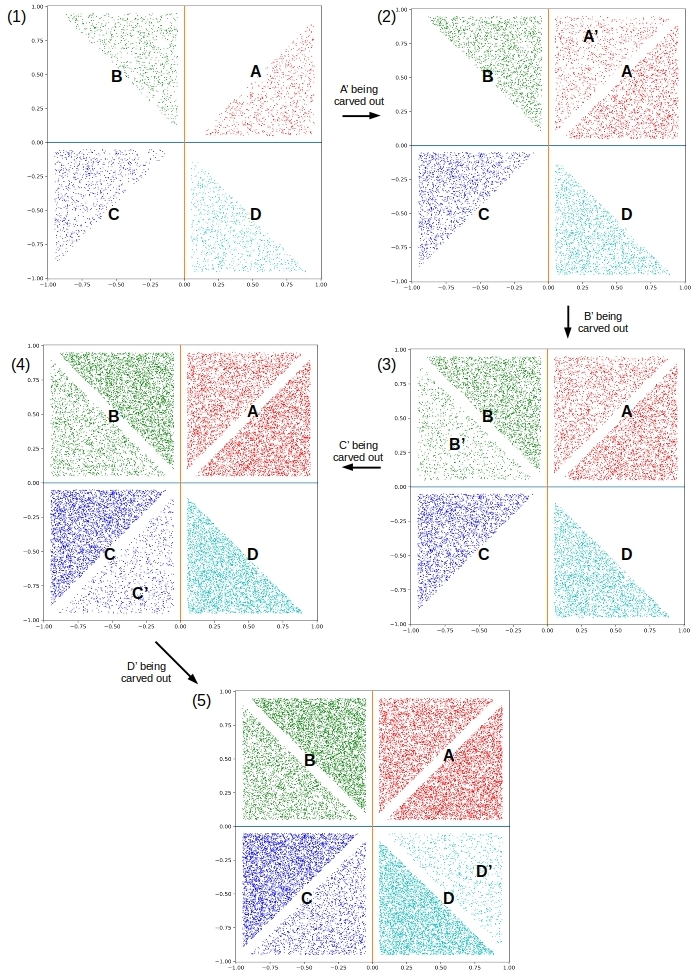
3.1 Low classification confidence zones
The following code snippet simulates batches of new data (without labels of course) with each batch adding about one percent of the initial number of points to the active data zones at that time. The active data zones start off as A-B-C-D and evolve through A-B-C-D-A’ => A-B-C-D-A’-B’ => A-B-C-D-A’-B’-C’ => A-B-C-D-A’-B’-C’-D’ in that order. This is quite clear from Figures 3.2-3.5 above showing new data zones A’ through D’ being carved out in the feature space with time.
nNew = int(nPoints/100)
zones = initialZones.copy()
for j in [0, 1, 3, 5, 7]:
    if j > 0:
        zones.append(j)
    for i in range(1, 5):
        new_data, new_labels = generateData(zones)
        new_probabilities = model.predict_proba(new_data)
        new_lcc_data = getLowClassificationConfidence (new_probabilities, new_data) # keep track of the data points below the threshold classification confidence
We keep track of the data points below the threshold classification confidence. Figure 4 shows the spatial distribution of these data points. As expected the zones with no training data show are the ones that light up in these charts.

This being a 2-feature problem we have the luxury of visualizing the fracking of feature space as in Figure 4. The fracking indicator helps us to detect the same in higher dimensions as it is a global scalar measure.
3.2 Fracking indicator
From Figure 4 it should be clear that the rate of increase of number of points has to see a spurt when a new data zone is starting to be carved out. Since we keep track of this number in the classification exercise Figure 5 below is easy to produce.

4. Conclusion
We set out with the goal of identifying feature space fracking by means of a global measure that can be used to trigger an evaluation of the affected new data for the potential usefulness of adding new classes.
- We defined classification confidence of a data point to be the maximum of all the probabilities that, that data point may belong to any of the classes trained upon
- We defined the fracking indicator to be the rate of increase of the number of new data points with lower than some threshold classification confidence
- With the help of an ideal, contrived problem (constant new data rates, steadily evolving new data zones etc…) we showed that spurts in fracking indicator pinpointed to the raise of potential new classes.
With real data including noise, variable data rates, evolving and dying data zones things can get murkier. Nevertheless, a dashboard monitoring plot such as Figure 5 will be useful in an ongoing classification exercise in production. If not for pinpointing the exact time a new class would be useful, but certainly for detecting when a “none-of-the-above” bucket should be split up.
This is a very nice article along with the concept drift. Is there a way to extend the data drift method in non classification tasks such as anomaly detection with isolation forest?